Python Pipeline Recreates LabPlot Scientific Workflows
A new Python-based implementation of the LabPlot scientific data workflow allows researchers to run advanced signal processing, peak fitting, and visualization directly in code.
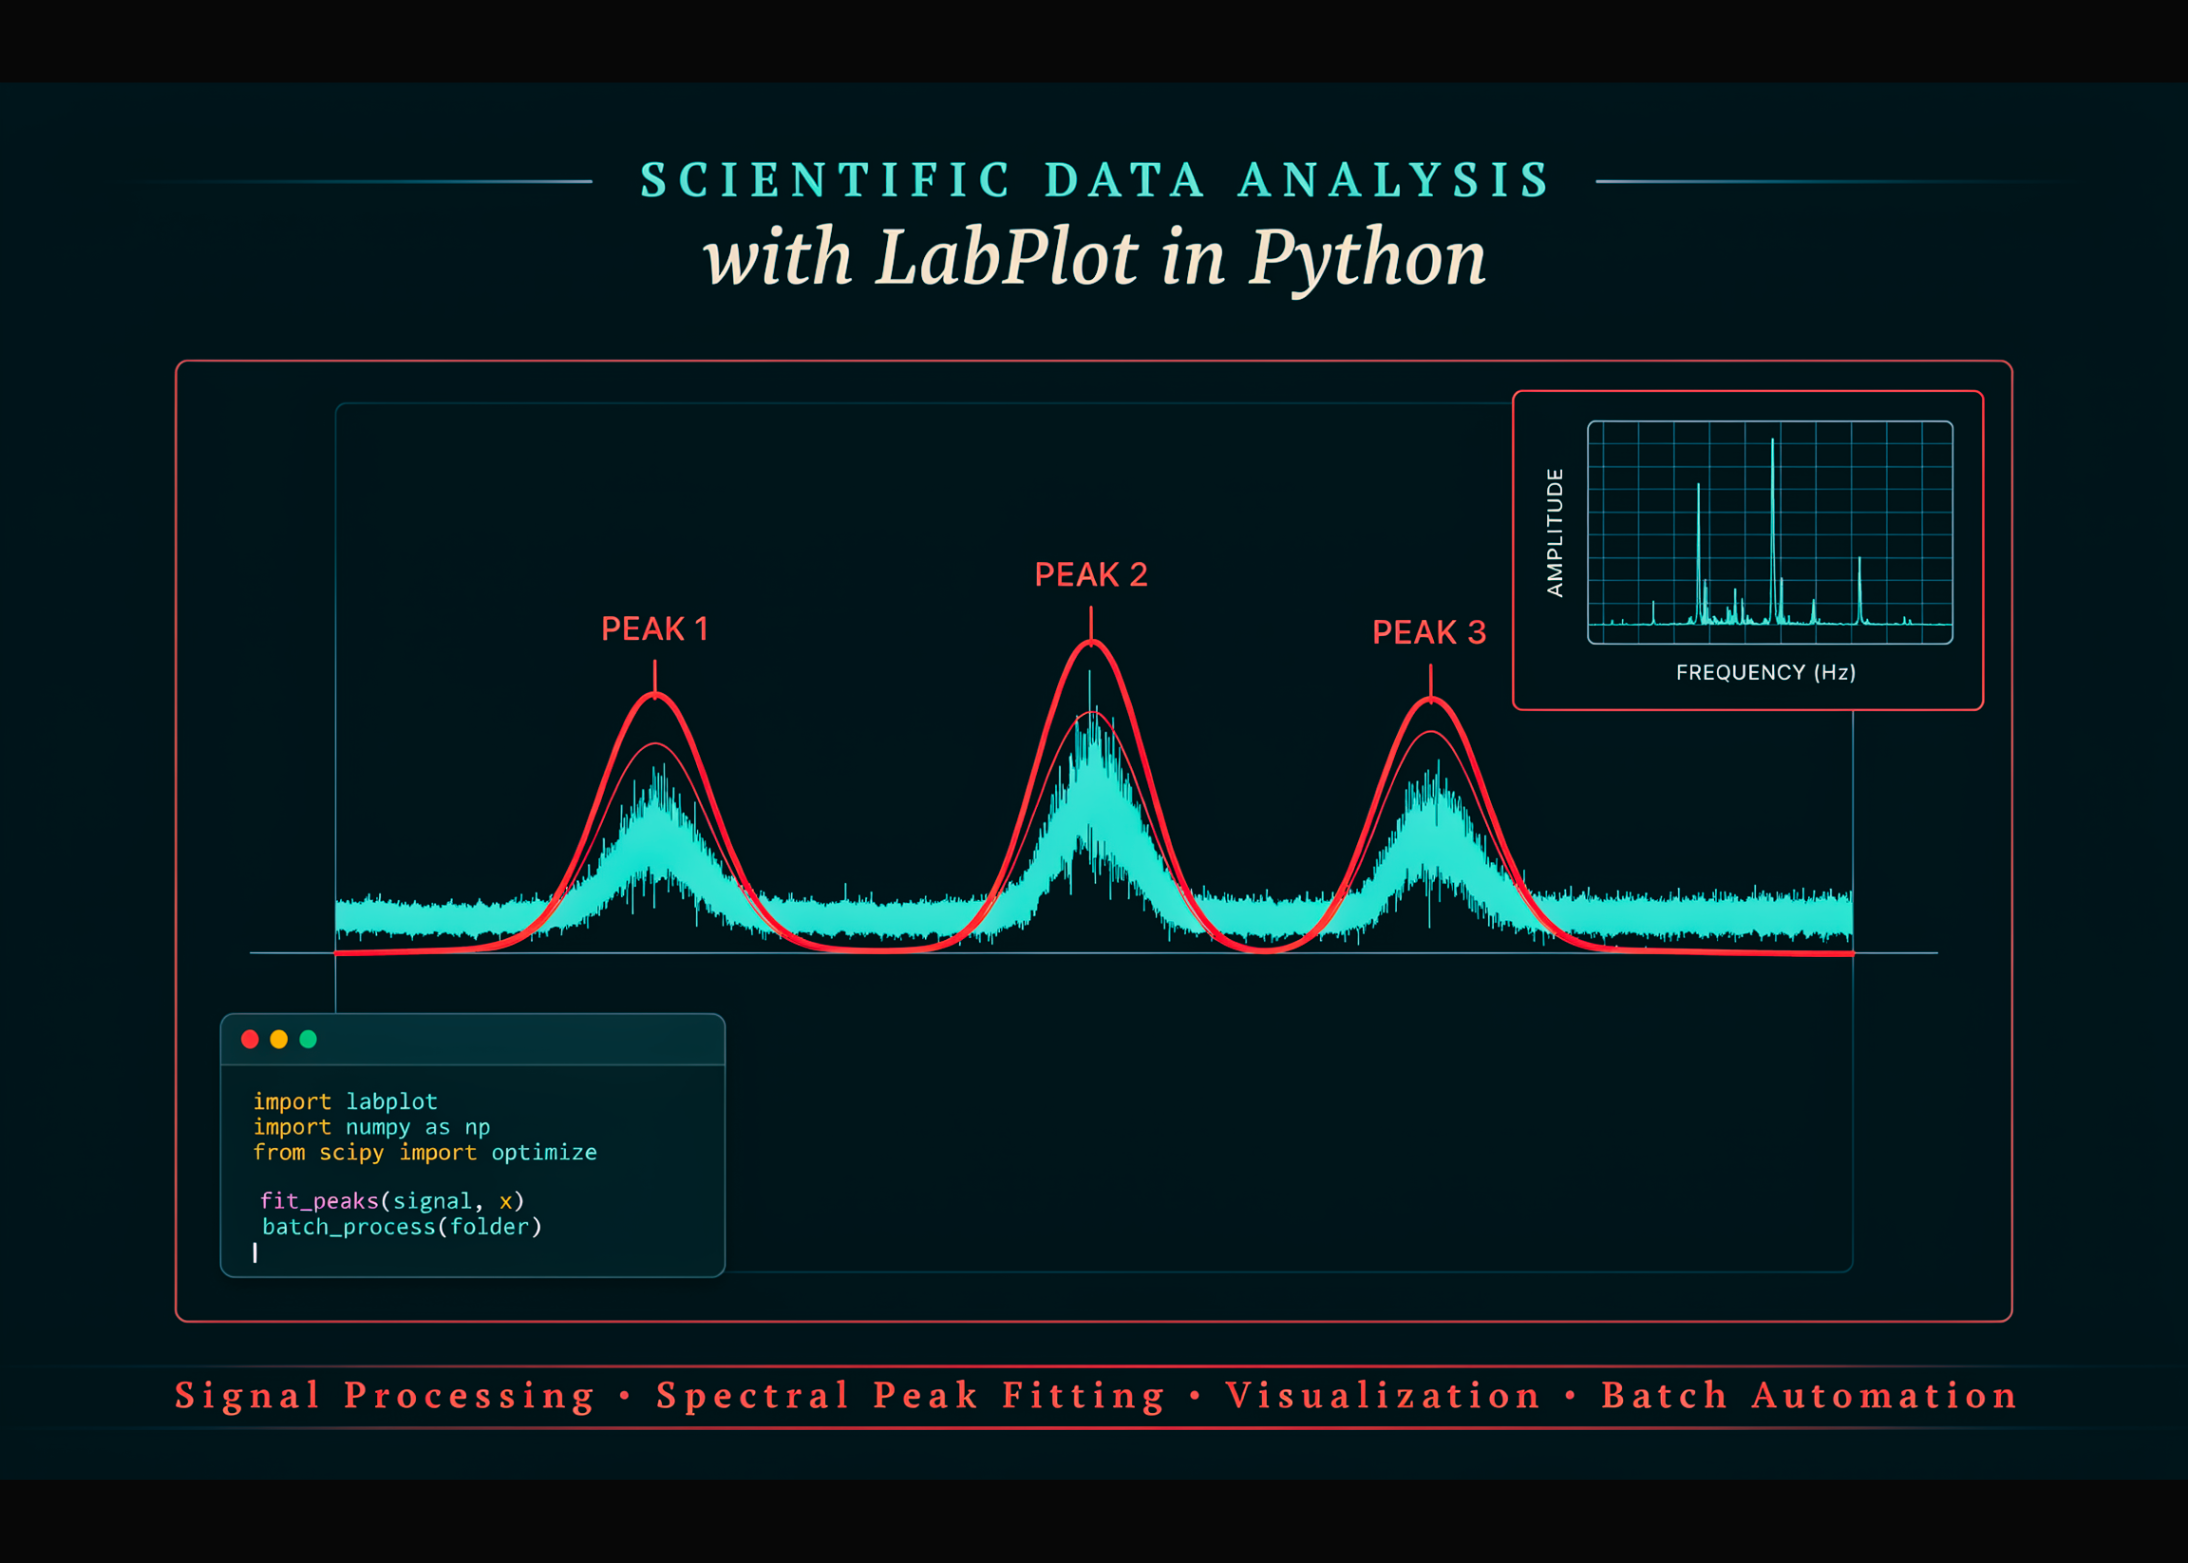
A new Python-based implementation of the LabPlot scientific data workflow has been developed, allowing researchers to replicate the desktop application's core architecture. The system preserves the structure of LabPlot version 2.12.1, including its aspect tree, analysis kernels, plotting system, and project model. This integration enables developers to programmatically import tabular data, calculate descriptive statistics, and save project data in LabPlot-compatible .lml files using gzip, bzip2, or xz compression.
The pipeline features robust numerical analysis kernels for signal processing. It includes Savitzky-Golay smoothing, differentiation, and Cartwright's formula for non-uniform Simpson integration. For spectral analysis, the system provides Fourier transforms with five windowing options—rectangular, Hann, Hamming, Blackman, and flat-top—alongside ideal or Butterworth Fourier filters for low-pass, high-pass, band-pass, and band-reject operations. It also incorporates the Hilbert transform, the Douglas-Peucker algorithm for data reduction, and automated peak-finding tools.
For advanced curve analysis, the Python environment supports Gaussian and Lorentzian peak models. It emulates GSL's multifit_nlinear solver using Scipy's Levenberg-Marquardt least-squares algorithm to perform non-linear fitting. The tool generates detailed statistical diagnostics, including 20 distinct column statistics, parameter uncertainties, confidence intervals, and goodness-of-fit metrics.
Visualizations are handled through Cartesian plots, histograms, and themed worksheets. Users can choose from pre-configured themes such as BlackOnWhite, Dracula, and SolarizedDark, and export their final figures directly. By moving these operations into Python, practitioners can easily automate batch processing for complex tasks, such as analyzing temperature-dependent spectra, while maintaining full compatibility with the desktop LabPlot interface.
This is our own summary of reporting by MarkTechPost



%22%3E%0A%3Cstop%20offset%3D%220%25%22%20stop-color%3D%22%231a1c1c%22%2F%3E%3Cstop%20offset%3D%22100%25%22%20stop-color%3D%22%234c4546%22%2F%3E%0A%3C%2FlinearGradient%3E%3C%2Fdefs%3E%0A%3Crect%20width%3D%22800%22%20height%3D%22500%22%20fill%3D%22url(%23g)%22%2F%3E%0A%3Cg%20stroke%3D%22%23ffffff%22%20stroke-opacity%3D%220.10%22%20stroke-width%3D%222%22%3E%0A%3Cline%20x1%3D%22-200%22%20y1%3D%22500%22%20x2%3D%22100%22%20y2%3D%220%22%2F%3E%3Cline%20x1%3D%22-60%22%20y1%3D%22500%22%20x2%3D%22240%22%20y2%3D%220%22%2F%3E%3Cline%20x1%3D%2280%22%20y1%3D%22500%22%20x2%3D%22380%22%20y2%3D%220%22%2F%3E%3Cline%20x1%3D%22220%22%20y1%3D%22500%22%20x2%3D%22520%22%20y2%3D%220%22%2F%3E%3Cline%20x1%3D%22360%22%20y1%3D%22500%22%20x2%3D%22660%22%20y2%3D%220%22%2F%3E%3Cline%20x1%3D%22500%22%20y1%3D%22500%22%20x2%3D%22800%22%20y2%3D%220%22%2F%3E%3Cline%20x1%3D%22640%22%20y1%3D%22500%22%20x2%3D%22940%22%20y2%3D%220%22%2F%3E%3Cline%20x1%3D%22780%22%20y1%3D%22500%22%20x2%3D%221080%22%20y2%3D%220%22%2F%3E%0A%3C%2Fg%3E%0A%3Ctext%20x%3D%2248%22%20y%3D%22430%22%20font-family%3D%22Helvetica%2CArial%2Csans-serif%22%20font-size%3D%22132%22%20font-weight%3D%22800%22%0A%20fill%3D%22%23ffffff%22%20fill-opacity%3D%220.22%22%20letter-spacing%3D%22-4%22%3ETD%3C%2Ftext%3E%0A%3C%2Fsvg%3E)